
MIDI visulisation (Max project) -- for Schubert's Trout Quintet
Intro
The patch is a general tool for midi visulisation which can read midi file, record notes' timing information (as prepared data) for drawing. The painting section read out the stored timing data, mapping them to the corresponding x/y coordinates in lcd canvas and draw some colorful patterns.
Providing these processing methods, the patch could be used for any midi file, but the current project is specifically for Trout Quintet (the 4th movement of Schubert's Piano Quintet in A major, D.667), the two-minute music piece embeded in the project is a short excerpt of the Trout theme.
The initial idea is quite simple --- get each midi note's pitch, velocity and duration, mapping to certain pattern's attribute, then draw it. However, as a visulisation for music, one big chanllenge is TIME. As every Max user knows, there's no timeline ready for you in Max environment. The build-in midi processing objects, like [midiparse], [midiinfo], [midiformat] and the sequencer [seq] can only give you individual midievent like pitch, velocity, ect. How to solve the timing problem became the core of this project.
"We don't want to baby you." --- from Max official Tutorial talking about the lack of timeline. Fortunately, Max provides enough timer objects to help you get time data. In the following section, I'll explain in detail about how I get midi note information, especially the time related data. I may omit most of the elementary argument/parameter settings of the common objects (which could be found in Max Help or Reference), as well as the automation design, but focus more on my idea for constructing this patch.
Technique for timing data

First thing first, find a not bad midi file for this piece of music. The Trout Quintet midi I found is not perfect but enough. It's a type 1 midi file which contains seperate tracks for each instrument. This is a must because each instrument needs a seperate line for its own pattern drawing. I split the midi file to the length I want and save each part as an individual midi file and they become later the default parameter of [seq] which is the core object of the main workflow.
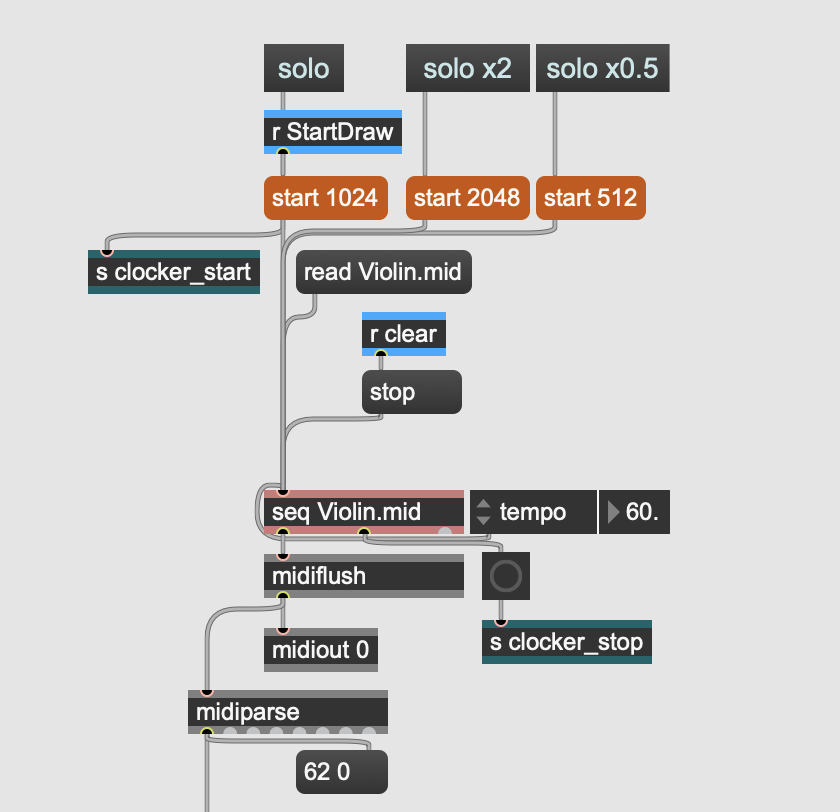


I keep all the patching details of this main flow out there without encapsulating it for showing and error checking. But it is actually the second step of the whole process. The first step is apparently to acquire note's timing data. For that, I designed a so-called timing data processor unit and this is where the biggest problem truly get solved.

Now, let's look inside.

As you can see, I used two [coll] to store data. The left one is for note duration, it stores each note's absolute length (in seconds). The core object in this part is [timer], I use note-on (i.e. velocity is not 0), as its starting trigger, and note-off as the stop signal. The object will output the elaspe time during this short period which is of course the note length. Meanwhile, using [counter] to add index. Therefore, I got note duration data like this:
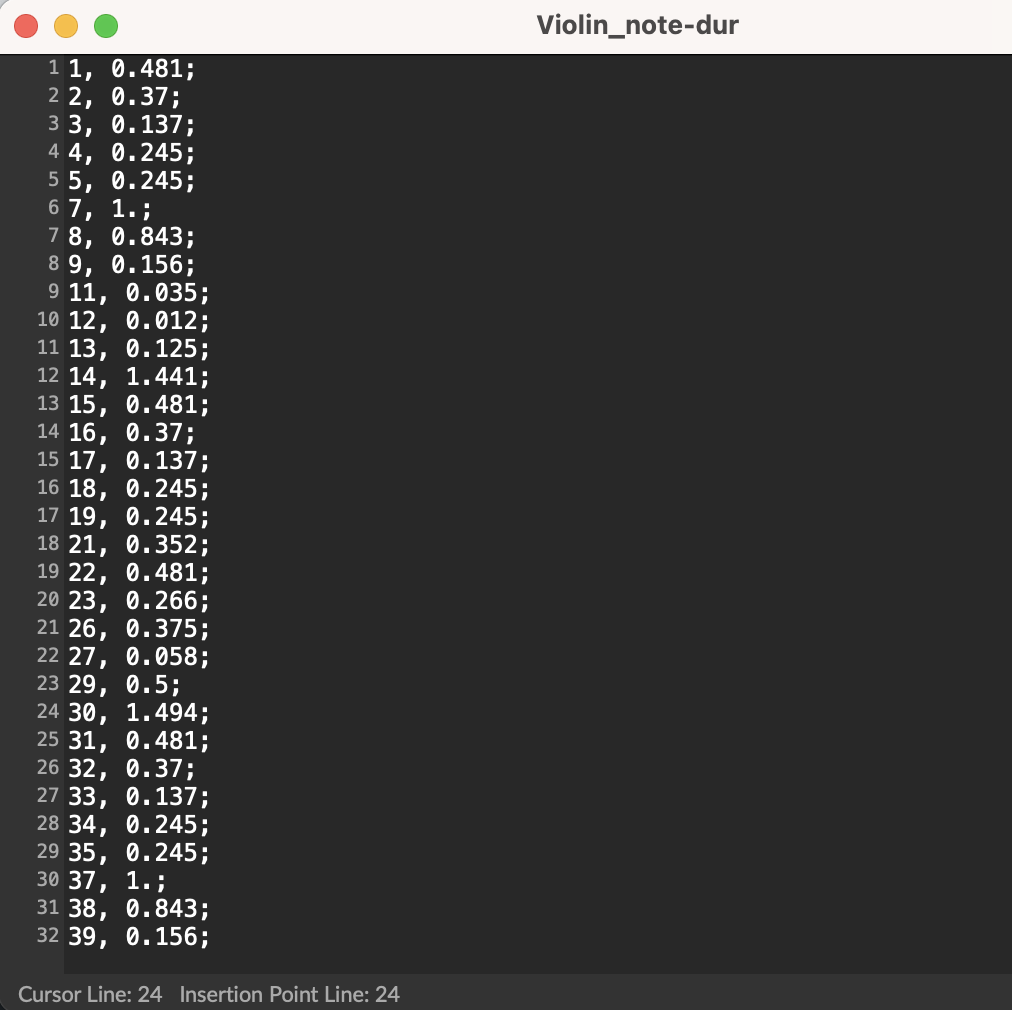
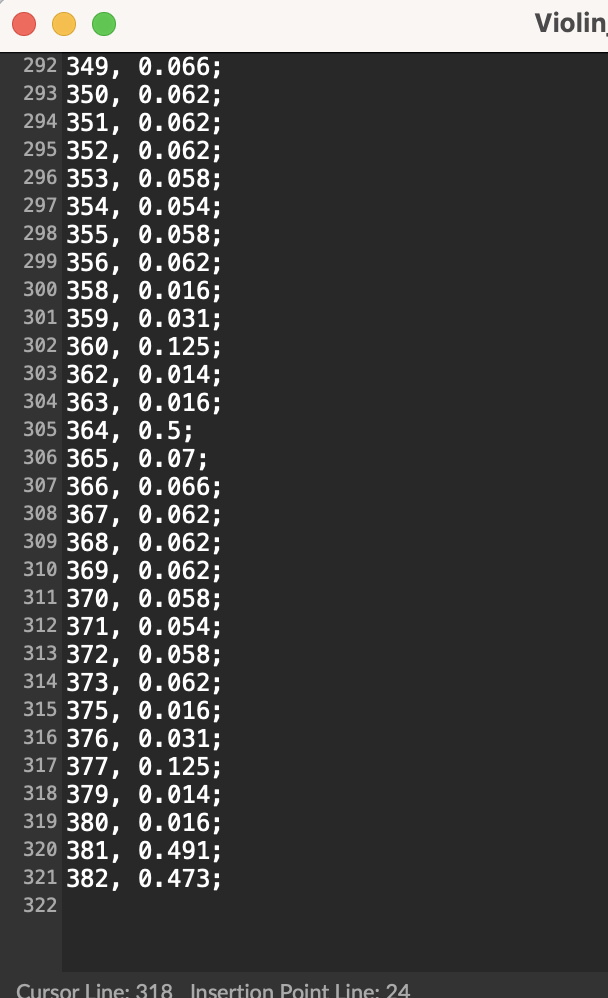
You may notice that the index I input is not consistent with the line number of the window. It's true that I lost some notes, for example, the 6th, the 36th and the 378th notes seem disappeared. I thought that's because of the overlapping of many notes that made the [timer] object couldn't catch all of them one by one until I tried the data recording again on another computer with higher speed processor. Not surprisingly though, I got exactly the same result. Therefore, I turned to the origin of all notes information --- [midiparse] .
I printed out the first few notes' midievent and realized that who 'stole' my notes --- [midiparse], the thief .

The selected line of 'midievent 145 74 74' refers to the sixth note. Each midi note should have a pair of 'on/off' information, as you can see in the red rectangular frames. However, the sixth note somehow loses its 'off' event. The [midiparse] object seems fail to parse all the midievents. A bug, perhaps?
This is indeed a limitation of the project which I couldn't conquer, so far. Luckily, I arranged a seperate [counter] object to follow each note based on 'note-on' signal, so the final timeline won't be affected. (One principle in this project is using build-in objects only to design my own algorithm, even thought it's not perfect. Thankfully, the overall effects are quite acceptable.)
Back to the "Timing Data Processor". The other [coll] on the right side is an interesting one. The logic behind note duration seems natural, but how can I place every note on a on-going timeline? My first idea is accumulation --- adding each note's duration onto the previous one, but that was way too wrong --- notes are not concatenating to each other head to tail, there is overlapping, there is rest. What I really need is absolute time . Here comes the real clock --- [clocker].

The [clocker] object keeps counting once a bang is sent to it. I need to collect each note's absolute position in a timeline, so the same trigger which used to bang the [counter] also used to report the current time. Certainly, the index has to be consistent with the left [coll] data. Considering the multi sounds of this music, absolute time data is crucial to align all the sounds. Therefore, I finally got my virtual timeline.

Another trick on the left side I didn't mention is [swap]. Why did I pack the data pair (index, duration) in the opposite way, then swap them deliberately and pack again?

Because the index number acquired from [counter] is always the fastest, but I have to wait for [timer] data before send them out. Here, the "cold inlet" of [pack] is super useful. The quick index number runs into [pack] and stays on standby, waiting for the later-coming timer data. They'll be sent out together once the "hot inlet" receives data. And the [coll] requires fixed format of input, so I just simply swap them.
Visualization
Once the data collection is finished, I can draw some patterns using these numbers. As a music visulisation, the horizontal axis is always representing time and the vertical axis usually refers to pitch, like how high or how low of a note. The objects I use here are all basic ones, like [lcd], [scale], etc. I dragged the lcd window into a wide canvas with the width of about 2000 and the height of about 500.
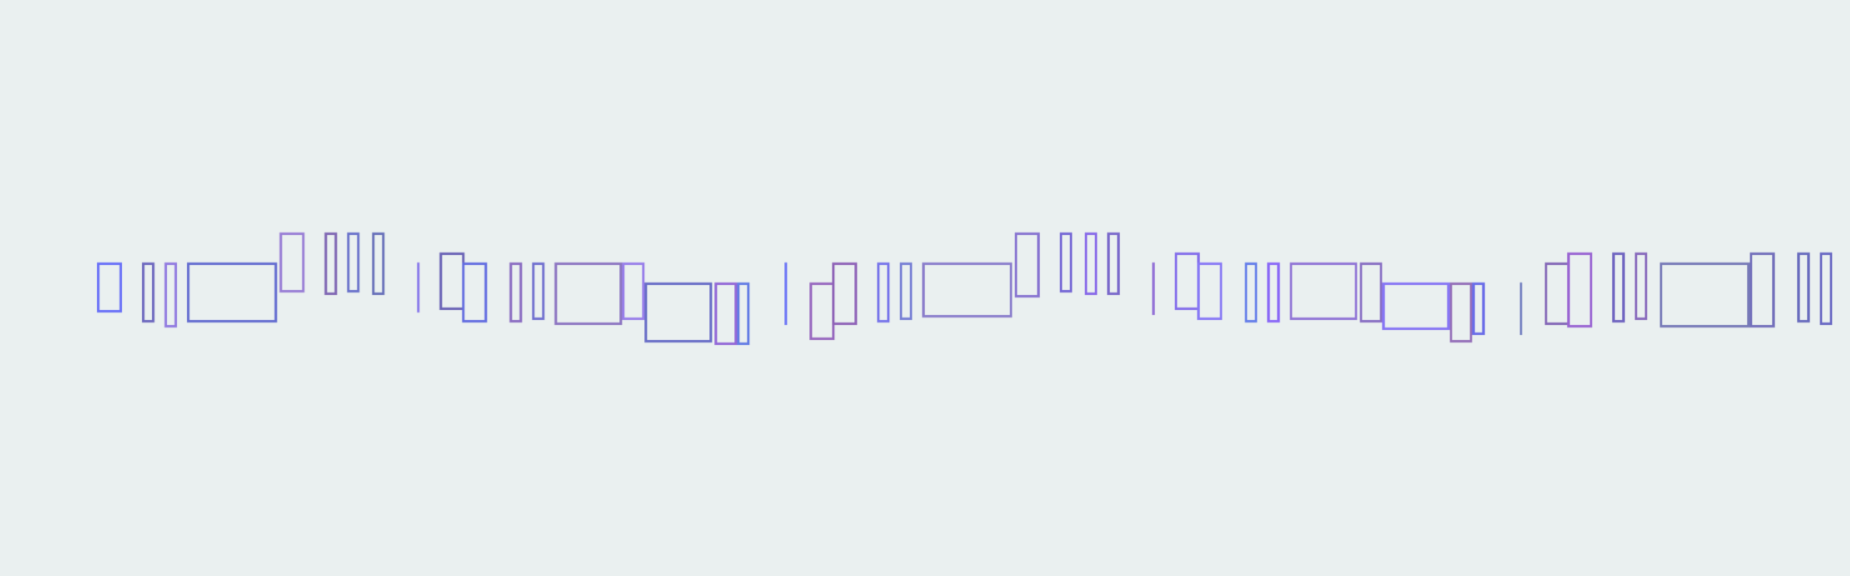
Higher pitch was given higher starting-y-coordinate and longer note was given wider width. From the patterns, you can generally identify a melody and its rhythm. To paint a rectangle (which refers to a note), I need at least four arguments (left, top, right, bottom) to specify its position and size (startX, startY, endX,endY). Starting x-coordinate is determined by a note's absolute time position and the ending x-coordinate is based on note's length. The two categories of data are the core issue I tackled in the first step.
As you can see below, data were read from the two [coll] and were mapped to corresponding coordinates of the [lcd] canvas. The startY argument is relatively easy, it simply comes from pitch value and was mapped to certain height. The endY determines the bottom position of a rectangle and the difference between startY and endY arguments decides a rectangle's height. Here, I just set a proper maximum height which is 60 (it could be larger of course) based on canvas's size and how many sounds I'm going to display.

Some of the patterns are not like "pattern" but a "line segment". It's actually a tiny narrow rectangle. In this limited canvas, some numbers might be super small.
You may notice that there's a stream of numbers at the bottom of the screenshot above. Besides the four arguments I've discussed already, the left three are RGB arguments. From the video you can see the patterns color keep changing but somehow in a certain range. That is resulted from a random RGB setting.

Each time a note/pattern is generated, the three [random] objects are banged at the same time. I set specific pattern and color range for each instrument, but the piano line looks much more colorful because I gave it a larger RGB range to make it unique, just like what I do with its vertical position. The relative vertical differences between four strings are roughly correct (with minor modification), but to highlight the piano line, I deliberately put it away from others.


In summary, this project is not the so-called live coding style even though it could be achieved theoretically, you can't throw it a new midi file and let it play and draw immediately. But still, I keep it in an automatic drawing while playing style. Considering the accuracy of calculation, a pre-loading of data is necessary. In the future, I may develop more animation like visulisation not in Max but using Python.
[========]
PS: some tech detail of the ever-changing-color background.